Public Transportation Condition |
|
Travel Characteristics
Mode wise trips
While the preferred mode of travel (motorised) in Pimpri-Chinchwad is two-wheelers, the predominant numbers of trips undertaken in the city are still pedestrian in nature followed by cycling. As can be seen from Figure 4, 59% of the trips generated in the city are on foot, 18% by cycling and a 10 percent by bus.
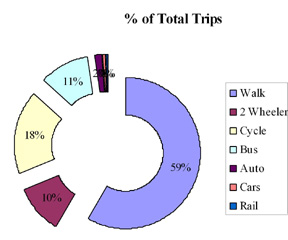
Figure :- Mode wise trips at Pimpri Chinchwad |
However, the estimated numbers of buses, stage carriers and contract carriers (forming the public transport system of the city) plying on the roads on a given day is just 2% indicating high level of congestion on public transport. Auto rickshaws constitute about 2% of the vehicles plying on the city roads. On the other hand, the numbers of two-wheelers plying on the city roads is 80% and four-wheelers 10%. This indicates a shift from public transport to personal transport in Pimpri-Chinchwad and the high growth in the numbers of two-wheelers
Per capita trip rate
The average per capita trip rate of the city is 1.1 for all modes of travelling including walking and cycling. For only motorized modes of traffic the per capita trip rate is 0.84.
Accident Profile
Road accidents have become a matter of great concern to all. The number of accidents on the roads of Pimpri-Chinchwad and the resulting casualties has been on the rise in the last decade.
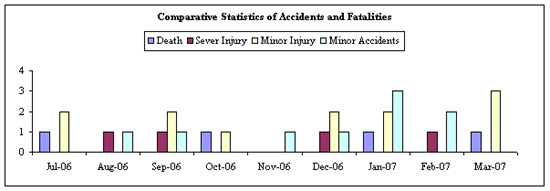
Figure : Comparative Statistics of Accidents and fatalities by PCMT buses
From the Figure, available with the RTO, fatal accidents form 28% of the total accidents recorded in Pimpri-Chinchwad. As regards the vehicular mode and involvement in accidents, buses have the highest involvement at 69 accidents per 10,000 registered vehicles followed by trucks at 47 accidents per 10,000 registered vehicles. This clearly presents the case to enhance traffic safety and enforcement on the city roads. Figure 5 above gives the Accidents statistics of the PCMT buses.
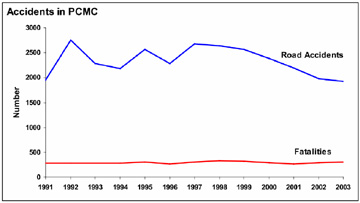
The most important fallout of the enormous number of vehicles on the road is the threat to the safety of pedestrians/ children and the aged. In Pune Metropolitan Region (PMR), about 300 persons die on account of road accidents every year. As presented in the above, the numbers of accidents occurring on the roads of PCMC per year figure in the range of 2000, out of which 300 of them are fatal in nature.
Ownership-Public Transport Agency Profile
The public transport in Pimpri-Chinchwad consists mainly of bus transport which is provided by Pune Mahanagar Parivahan Mahamandal Limited (PMPML) which emerged from merger of Pimpri-Chinchwad Municipal Transport (PCMT) and Pune Municipal Transport (PMT). PCMT was started as an independent agency under the aegis of then Pimpri-Chinchwad Municipal Council and later Pimpri- Chinchwad Municipal Corporation in 1974. The transport committee, set up under section 25 of the Bombay Provincial Municipal Corporations Act, 1949, managed the PCMT.
PMPML currently operated 33 routes with 1562 buses covering both PCMC and PMC areas, out of which 326 buses operate as hired fleet. The age wise distribution of the remaining 1236 buses which includes buses owned and operated by PMPML have been given in Table 7 . It can be seen from the table that 101 buses are more than 10 years old, out of which 27 are more than 15 years old. Such old vehicles not only consume more fuel, emit more pollutants, break down more often but are also unattractive to the users who, as a result of which public transport users tend to move away towards personal vehicles, wherever feasible. The detail sheet of age wise distribution of buses is attached as Annexure 13.
Age profile of Bus
Sr. No. |
Age
|
No. of buses |
1 |
Less than 5 years |
708 |
2 |
Between 6 to 10 years |
427 |
3 |
Between 11-15 years |
74 |
4 |
More than 15 years |
27 |
Physical Profile
Prior to formation of PMPML till 2006, the city bus service in Pimpri Chinchwad was provided by PCMT a wholly Government-owned company. The fleet utilization of PCMT ranged from as low as 48% to 61% in 2001. There has however, been an improvement since the formation of PMPML and the fleet utilization has gone up to 75%. The bus staff ratio has come down to 9 under PMPML from 14 under PCMT, mainly due to distribution of staff over a larger fleet of 1236 buses. There has also been an improvement in the occupancy ratio, which has gone up from as low as 34% in 200-01 to 76% in 2007-08.
It is clear that the performance of PCMT/ PMPML has been slowly improving over time. However one of the major hurdles in fast tracking the process is the availability of fleet and the age profile of the existing fleet. Operations along certain corridors such as old Mumbai Road are concentrated with good frequencies but on other routes the frequencies are less resulting in higher waiting time for customers. There is thus, a need for increasing the number of buses, so that the projected demand can be met. However, since the company has been facing operating losses, it has not been able to make the required investments in adding to its fleet. The performance for the period 2000-2006 for PCMT and 2007-08 for PMPML is given in Table 8.
Physical Performance of PCMT/PMPML
No |
Parameter |
Units |
2000-01 |
2001-02 |
2002-03 |
2003-04 |
2004-05 |
2005-06 |
2006-07* |
2007-08* |
1 |
Fleet Strength |
(Nos.) |
232 |
232 |
232 |
187 |
212 |
288 |
1214 |
1287 |
2 |
Effective Kms |
(Cr) |
1.5 |
1.1 |
1.1 |
1.1 |
1.19 |
1.38 |
0.66 |
0.69 |
3 |
Kms/Bus/Day |
(Kms) |
284 |
259 |
280 |
281 |
266 |
264 |
231 |
234 |
4 |
Fleet Utilisation |
(%) |
61 |
52 |
48 |
55 |
58 |
59 |
74 |
75 |
5 |
Occupancy Ratio |
(%) |
34 |
37 |
45 |
50 |
53 |
52 |
75 |
76 |
6 |
Bus Staff Ratio |
(Nos.) |
14 |
16 |
17 |
14 |
15 |
16 |
10 |
9 |
7 |
Accidents/Lakh Km |
(Nos.) |
0.8 |
0.5 |
0.6 |
0.6 |
0.5 |
0.5 |
0.41 |
0.39 |
8 |
Breakdown/10000Km |
(Rs.) |
8 |
10 |
11 |
13 |
16 |
14 |
1.52 |
0.68 |
*The performance of PMPML, which succeeded PCMT in 2007 has been given for the calender year 2007 and 2008 in Table 8above.
Fare Strecture
Currently as per the fare policy of Pimpri Chinchwad, distance based fare structure is being used as given in Table 10. The minimum fare being charged currently is Rs 5 for an average distance of 1 km and the maximum is Rs 27 for a distance of about 40 km, however the statistical data of PMPML suggests that the average fare being charged by PMPML is Rs 7 per person per trip.
Existing Fare Structure for Pimpri-Chinchwad
No. |
KM Range |
Fare in INR |
1 |
0-2 |
5 |
2 |
2-4 |
7 |
3 |
4-6 |
8 |
4 |
6-8 |
9 |
5 |
8-10 |
10 |
6 |
10-12 |
12 |
7 |
12-14 |
13 |
8 |
14-16 |
15 |
9 |
16-18 |
15 |
10 |
18-20 |
18 |
11 |
20-22 |
18 |
12 |
22-24 |
20 |
13 |
24-26 |
20 |
14 |
26-28 |
22 |
15 |
28-30 |
22 |
16 |
30-32 |
24 |
17 |
32-34 |
24 |
18 |
34-36 |
25 |
19 |
36-38 |
25 |
20 |
38-40 |
27 |
Fleet Operation and Ridership
PMPML currently operates about 347 routes (excluding BRTS) with 1625 buses (1260 owned and the balance hired). The total ridership on PMPML buses is given in Table 11.
PMPML Ridership per Annum
Year |
Ridership / annum (Lakh) |
2007 |
6.13 |
2008 |
8.07 |
2009 |
9.71 |
|